Television Station Weather Forecast Accuracy Study
Kantar conducted a study to evaluate the accuracy of forecasts across different TV stations for AccuWeather

AccuWeather KFSN Forecast Proven Most Accurate and Most Detailed

The recent study by Kantar gathered, analyzed and compared the on-air televised weather forecast presentations of KGPE, KMPH and KSEE local stations with the AccuWeather forecast on KFSN to determine which had the most accurate forecast.

Methodology

For maximum consistency, the 6 pm local time, Monday to Friday, on-air TV weathercast, which most stations provide, was viewed, and the forecast from this telecast was recorded and compared and the results verified.

Forecasts were verified by comparing them to observed data from US National Weather Service official data sources. For a complete glossary of all terms, calculations and data sources see Appendix A and Appendix B.


Findings:

The AccuWeather/KFSN Weather Forecast is the Most Accurate in Fresno

  • The AccuWeather/KFSN forecasts were 17.4% more accurate than the competitor average
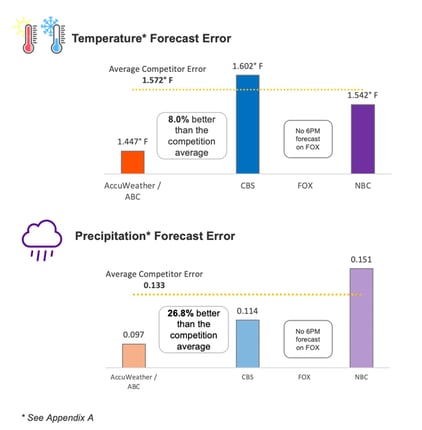
  • The AccuWeather/KFSN weather forecast was 8% better than the competitor average in forecasting temperature
  • The AccuWeather/KFSN weather forecast was 26.8% better than the competitor average in forecasting precipitation
kfsn-forecast-stacked
 

kfsn-temp-prediction

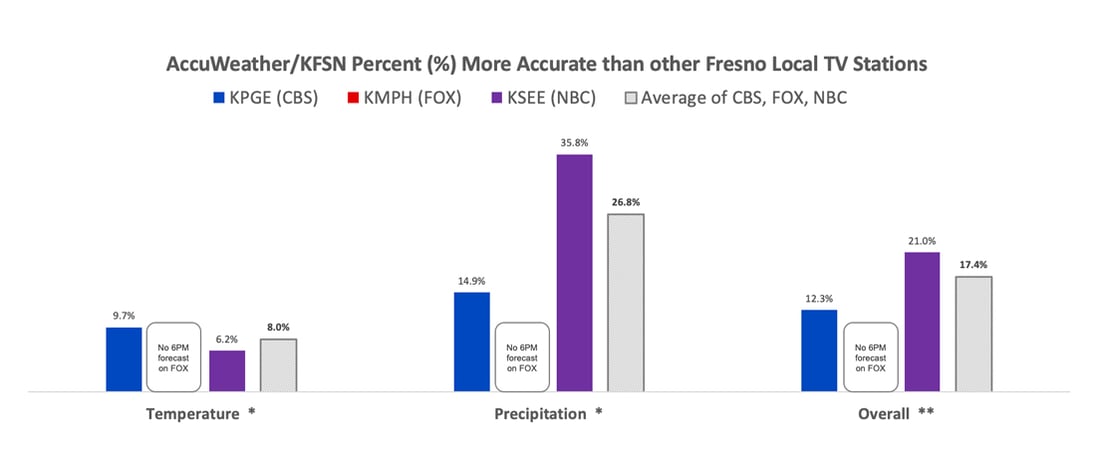
AccuWeather/KFSN is Most Accurate for Temperature and Precipitation

The graph shows the overall accuracy of the AccuWeather/KFSN weathercast vs. other local TV stations in the Fresno market. The AccuWeather/KFSN forecasts were the most accurate overall by 17.4%. AccuWeather/KFSN weather forecast was 12.3% more accurate than KGPE (CBS), and 21% more accurate than KSEE (NBC).


AccuWeather/KFSN Weather Forecast Ranked #1 in Fresno for Providing Impact-Driven, Useful Details

In Fresno, the AccuWeather/ABC station, KFSN, provided the most impact-driven weathercasts with much more useful and localized forecast detail and important information than the other Fresno stations.

The AccuWeather/KFSN weathercast was ranked #1 in providing the most detail:

  • Traveler information: 4.7 times more often
  • Travel delays: 4.5 times more often
  • Events forecast: 3.7 times more often
  • Regional snow variations: twice as often
  • Road conditions: twice as often
  • Variation in snowfall amounts across the viewing area: 50% more often
  • Variation of snow accumulation on paved and unpaved surfaces: 50% more often
  • Variation in type of precipitation across the viewing area: 44% more often
  • Timing on when fog will break or form: 25% more often
  • Variation in amount of rain across area: 16% more often
  • Provides forecasts for beaches, mountains, or other areas of interest: 14% more often
  • Timing of changeover in the type of precipitation: 11% more often
  • Weather comparisons across days: 9% more often

About Kantar

Kantar is the world’s leading data, evidence-based, insights and consulting company, serving more than half of the Fortune 500 companies worldwide.

We have a complete, unique and rounded understanding of how people think, feel and act; globally and locally in over 90 markets. By combining the deep expertise of our people, our data resources and benchmarks, our innovative analytics and technology, we help our clients understand people and inspire growth.


Appendix A — Definitions

  1. Brier Score – A standard measure of the accuracy of probability of precipitation forecasts. Uses the forecasted probability (e.g. 60% = 0.6) and the observed precipitation (e.g. 0 for no precipitation OR 1 for precipitation). The resulting equation is (F – O)2 which is then summed for the entire dataset. Numbers close to 0 signify a more accurate forecast.
  2. Average Error –The average of the given accuracy metric. For example, if showing the average competitor error in a temperature chart, this is the average of errors from each competitor over the course of the study. If KGPE had a temperature error of 4F, KMPH an error of 2F, and KSEE and error of 3F, the average error would be 3F.
  3. Precipitation – The Brier scores (see above) were aggregated for all forecasts during the study for forecast Days 1 to 5 (Monday through Friday). Therefore, the precipitation accuracy results in this study show the accuracy of probability of precipitation forecasts. In a case where specific probability was not mentioned, the forecast text predicting the precipitation was used to provide a percentage value. A mention of words that indicated uncertainty like “showers possible,” “might rain,” “rain possible” was given a value of 50%. A certain mention of precipitation was given a value of 100%.
  4. Temperature – For temperature, average temperature was calculated using high and low, adding them together and dividing by 2. This was done for both forecast temperature (Days 1 to 5) and observed temperatures. The absolute error was then averaged across all forecasts.

Appendix B — TV Station Weather Forecast Accuracy Study
The study was conducted between February 3rd and April 3rd 2020

Forecast data was gathered using the on-air televised weather forecast by viewing the archived footage available through TVEyes.
Observation Locations
Observed data was gathered from official U.S. National Weather Service observation sites using these links: